This Means RaWaR

The Overlord of the Über-Feral says: Welcome to my bijou bloguette. You can scroll down to sample more or simply:

• Read a Writerization at Random: RaWaR


• ¿And What Doth It Mean To Be Flesh?

• მათემატიკა მსოფლიოს მეფე


Gweel & Other Alterities – Incunabula’s new edition


Tales of Silence & Sortilege – Incunabula’s new edition


If you’d like to donate to O.o.t.Ü.-F., please click here.

I Hike Gryke

Here are the simplified fractions in order of increasing denominator and numerator:

1/2, 1/3, 2/3, 1/4, 3/4, 1/5, 2/5, 3/5, 4/5, 1/6, 5/6, 1/7, 2/7, 3/7, 4/7, 5/7, 6/7, 1/8, 3/8, 5/8, 7/8, 1/9, 2/9, 4/9, 5/9, 7/9, 8/9, 1/10, 3/10, 7/10, 9/10, 1/11, 2/11, 3/11, 4/11, 5/11, 6/11, 7/11, 8/11, 9/11, 10/11, 1/12, 5/12, 7/12, 11/12, 1/13, 2/13, 3/13, 4/13, 5/13, 6/13, 7/13, 8/13, 9/13, 10/13, 11/13, 12/13, …

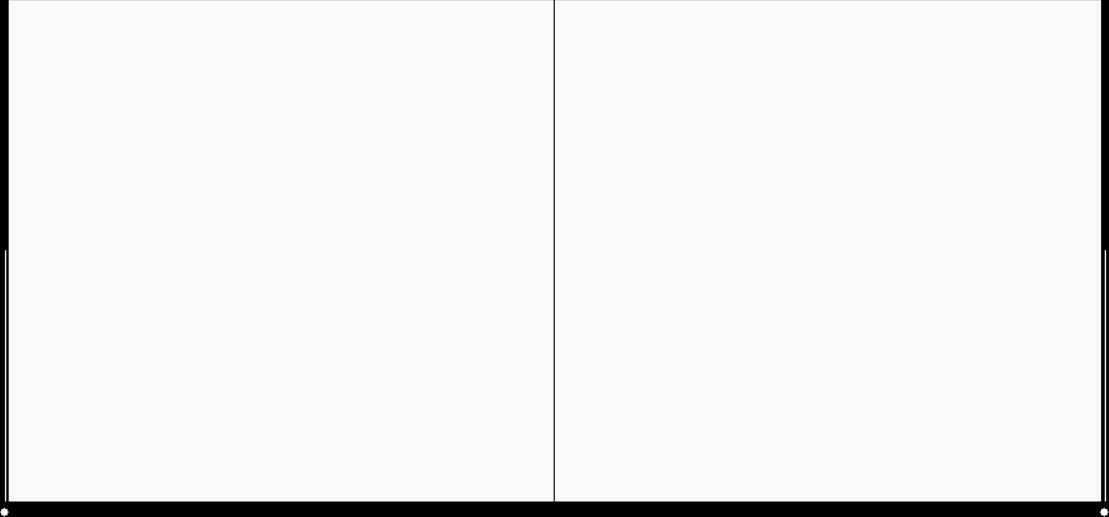
You get 1/4 and 5/12, but no 2/4 or 3/12 and so on, because the fractions are simplified and 2/4 = 1/2 and 3/12 = 1/4. Now suppose you map those simplified fractions on a graph of x = y = 1/2, 1/3, 2/3, 1/4, 3/4, 1/5, … The graph is obviously just a straight line at 45°:
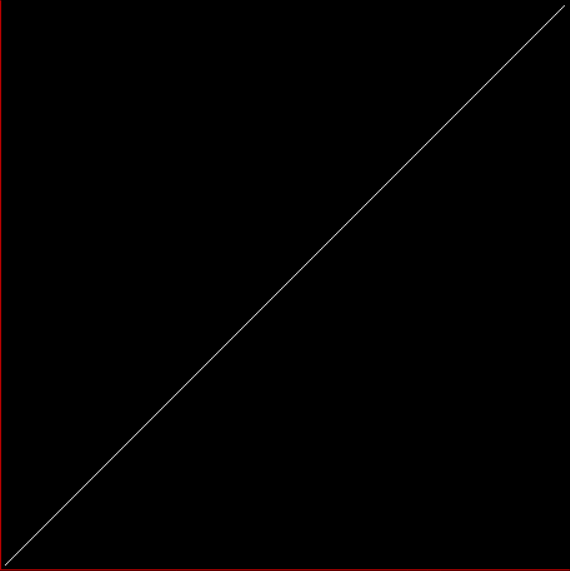
Graph of x = y = 1/2, 1/3, 2/3, 1/4, 3/4, 1/5, …


But suppose you adjust some of the simplified fractions for y, so that the list looks like this (adjusted fractions appear in red):

1/2, 1/3, 2/3 → 1/3, 1/4, 3/4 → 1/4, 1/5, 2/5, 3/5 → 2/5, 4/5 → 1/5, 1/6, 5/6 → 1/6, 1/7, 2/7 → 3/7, 3/7 → 2/7, 4/7 → 2/7, 5/7 → 3/7, 6/7 → 1/7, 1/8, 3/8, 5/8 → 3/8, 7/8 → 1/8, 1/9, 2/9 → 4/9, 4/9 → 2/9, 5/9 → 2/9, 7/9 → 4/9, 8/9 → 1/9, 1/10, 3/10, 7/10 → 3/10, 9/10 → 1/10, 1/11, 2/11 → 5/11, 3/11 → 4/11, 4/11 → 3/11, 5/11 → 2/11, 6/11 → 2/11, 7/11 → 3/11, 8/11 → 4/11, 9/11 → 5/11, 10/11 → 1/11, 1/12, 5/12, 7/12 → 5/12, 11/12 → 1/12, 1/13, 2/13 → 6/13, 3/13 → 4/13, 4/13 → 3/13, …

What does the graph for straight x and adjusted y look like? Much more interesting:
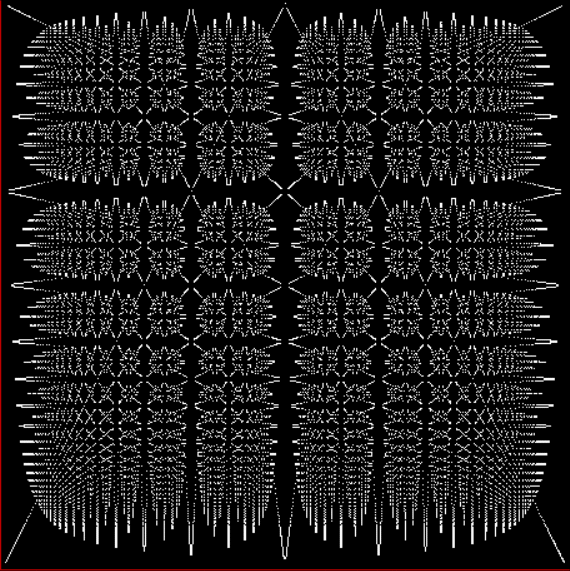
Graph of x = 1/2, 1/3, 2/3, …, y = contfrac_rev(1/2), contfrac_rev(1/3), contfrac_rev(2/3), …


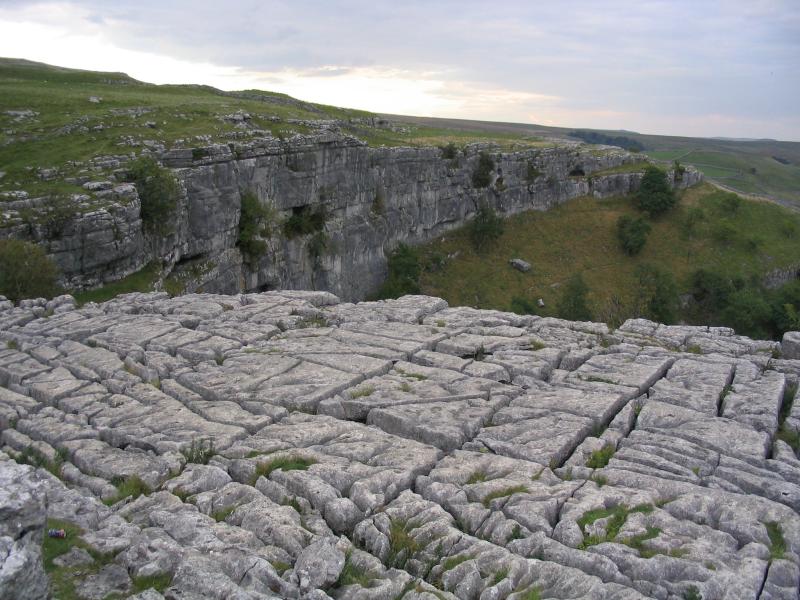
That graph is what you could call a fractional fractal, because it uses fraction to create a fractal where parts resemble the whole and parts of the parts resemble the whole, down and down for ever (as I’ll show). I call it a limestone fractal or gryke fractal, because it looks like the fissured limestone pavements in the Yorkshire Dales, where the fissures are called grykes:
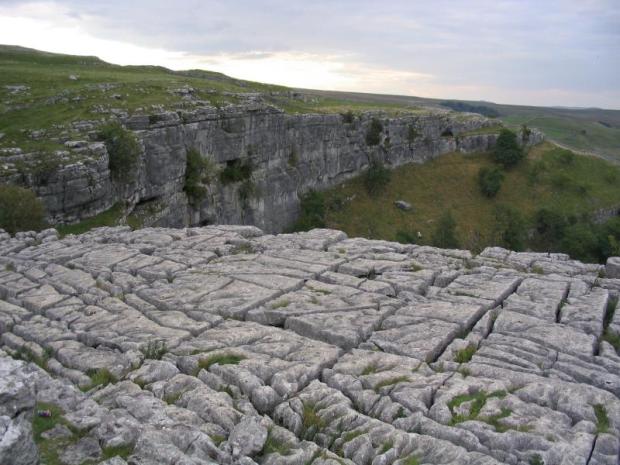
Fissured limestone pavement, Yorkshire Dales (Wikipedia)
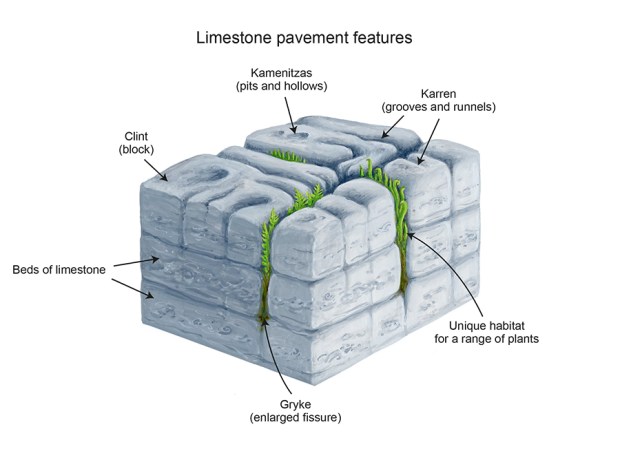

A closer look at a limestone pavement (Dales Rocks)


As you plot the fractions for x and adjust the fractions for y, the gryke graph grows like this:
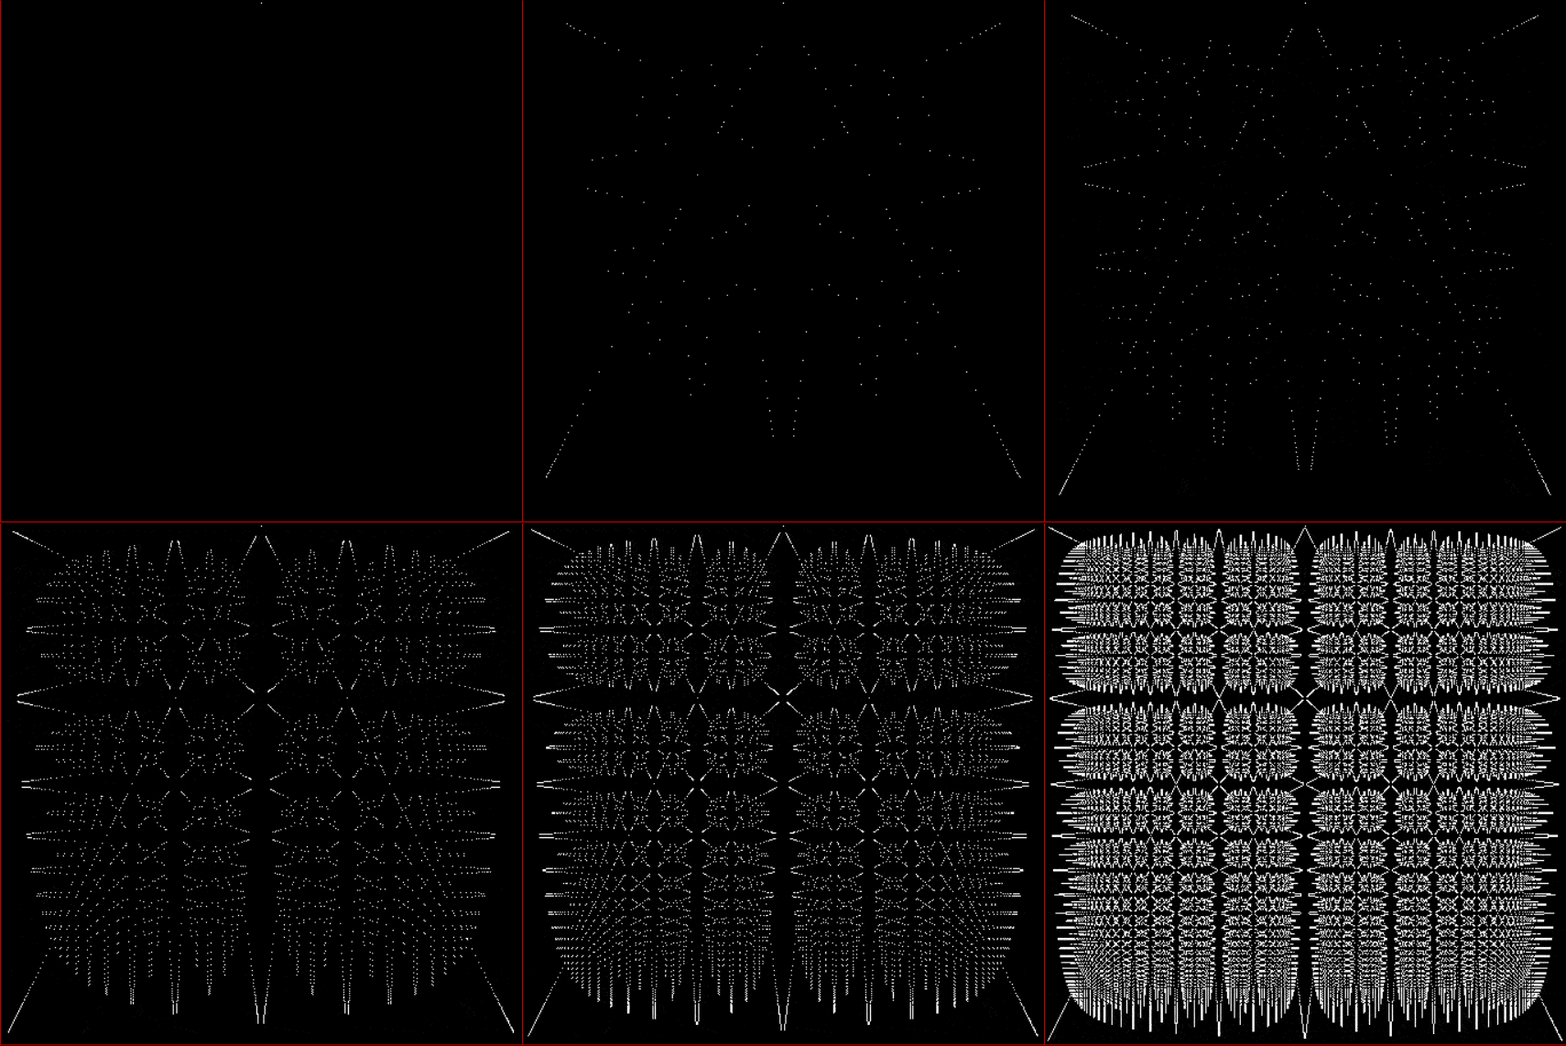
The gryke graph grows (animated at ezGif)


But how were the fractions for y adjusted to create the gryke fractal? With a very simple function called contfrac_rev(a/b). The function takes what’s called the continued fraction of a/b, then reverses it to derive a new fraction (sometimes it’s new, at least). For example, here’s the continued fraction of 13/17 and how you use the continued fraction to reconstruct 13/17:

continued_fraction(13/17) = [1,3,4] = cf(13/17)

fr = 0
1/4 = 1/(fr + 4) = 1/(0 + 4)
4/13 = 1/(fr + 3) = 1/(1/4 + 3)
13/17 = 1/(fr + 1) = 1/(4/13 + 1)

13/17 = 0.764705882352941176470588…

The continued fraction, [1,3,4], is read from right to left when the original fraction is being reconstructed. So reversing the continued fraction means reading it from left to right, like this:

fr = 0
1 = 1/(fr + 1) = 1/(0 + 1)
1/4 = 1/(fr + 3) = 1/(1 + 3)
4/17 = 1/(fr + 4) = 1/(1/4 + 4)

4/17 = 0.235294117647058823529411…

(Technical note: The reversed fraction of cf_rev(a/b) is always < 1/2, except for cf_rev(1/2) = 1/2. That's why the gryke graph above actually represents 0 to 1 on the x-axis and 0 to 0.5 on the y-axis.)

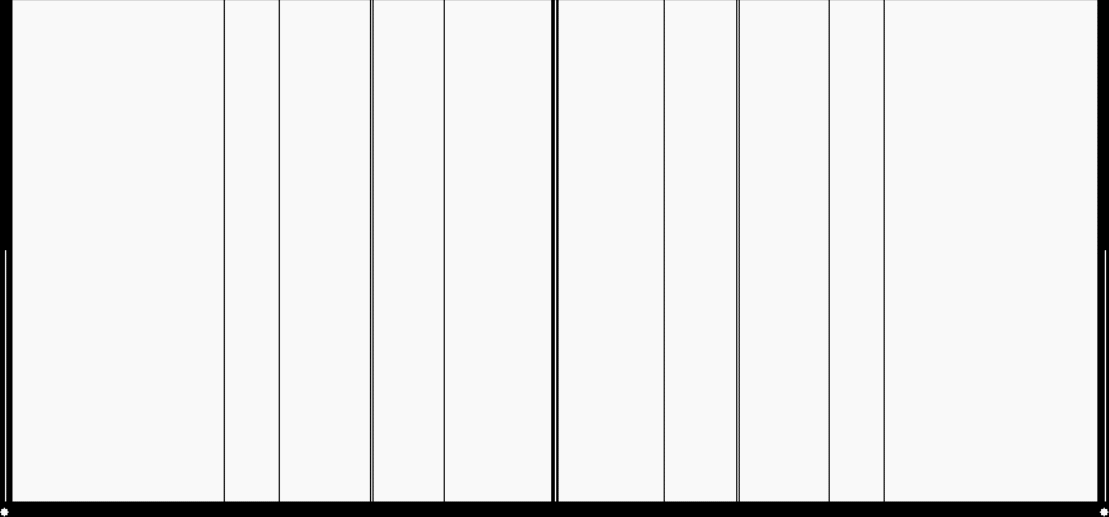
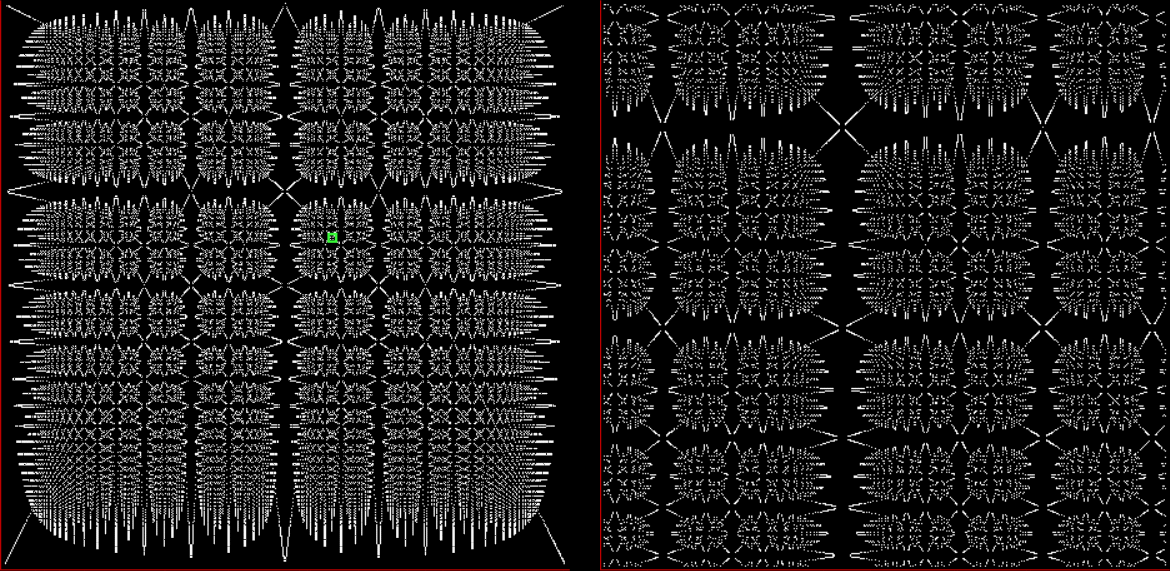
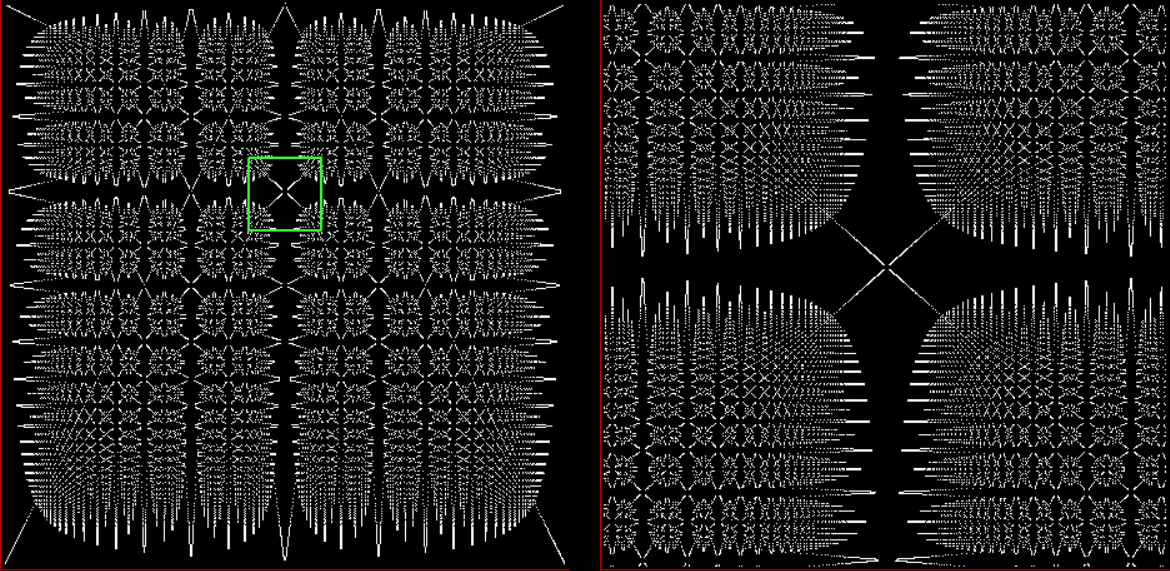
Now let's look at how the fractal in the graph can be magnified for ever and always yield new versions of the original graph. You can call it hiking the gryke, because you hike or increase the resolution of the graph to reveal the finer details. The first step is to mark the gryke site to be hiked. Here's the full graph, with a green square showing the section to be hiked or magnified or zoomed:
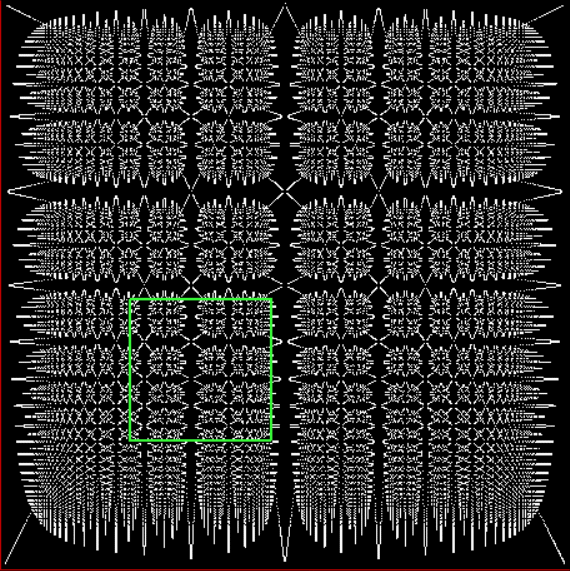
Gryke to hike

↓
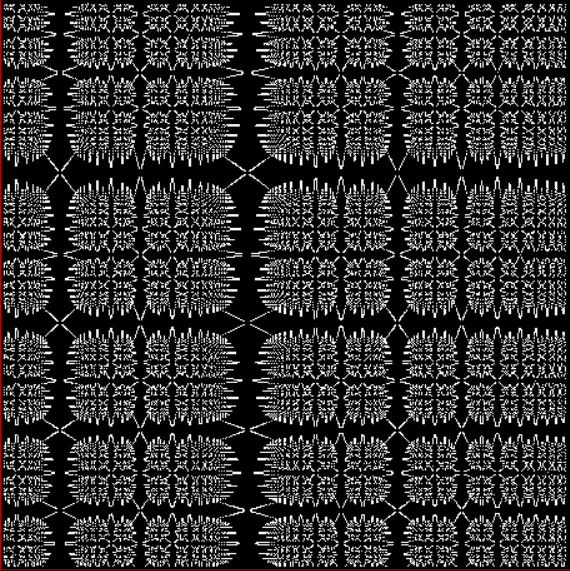
Gryke hiked


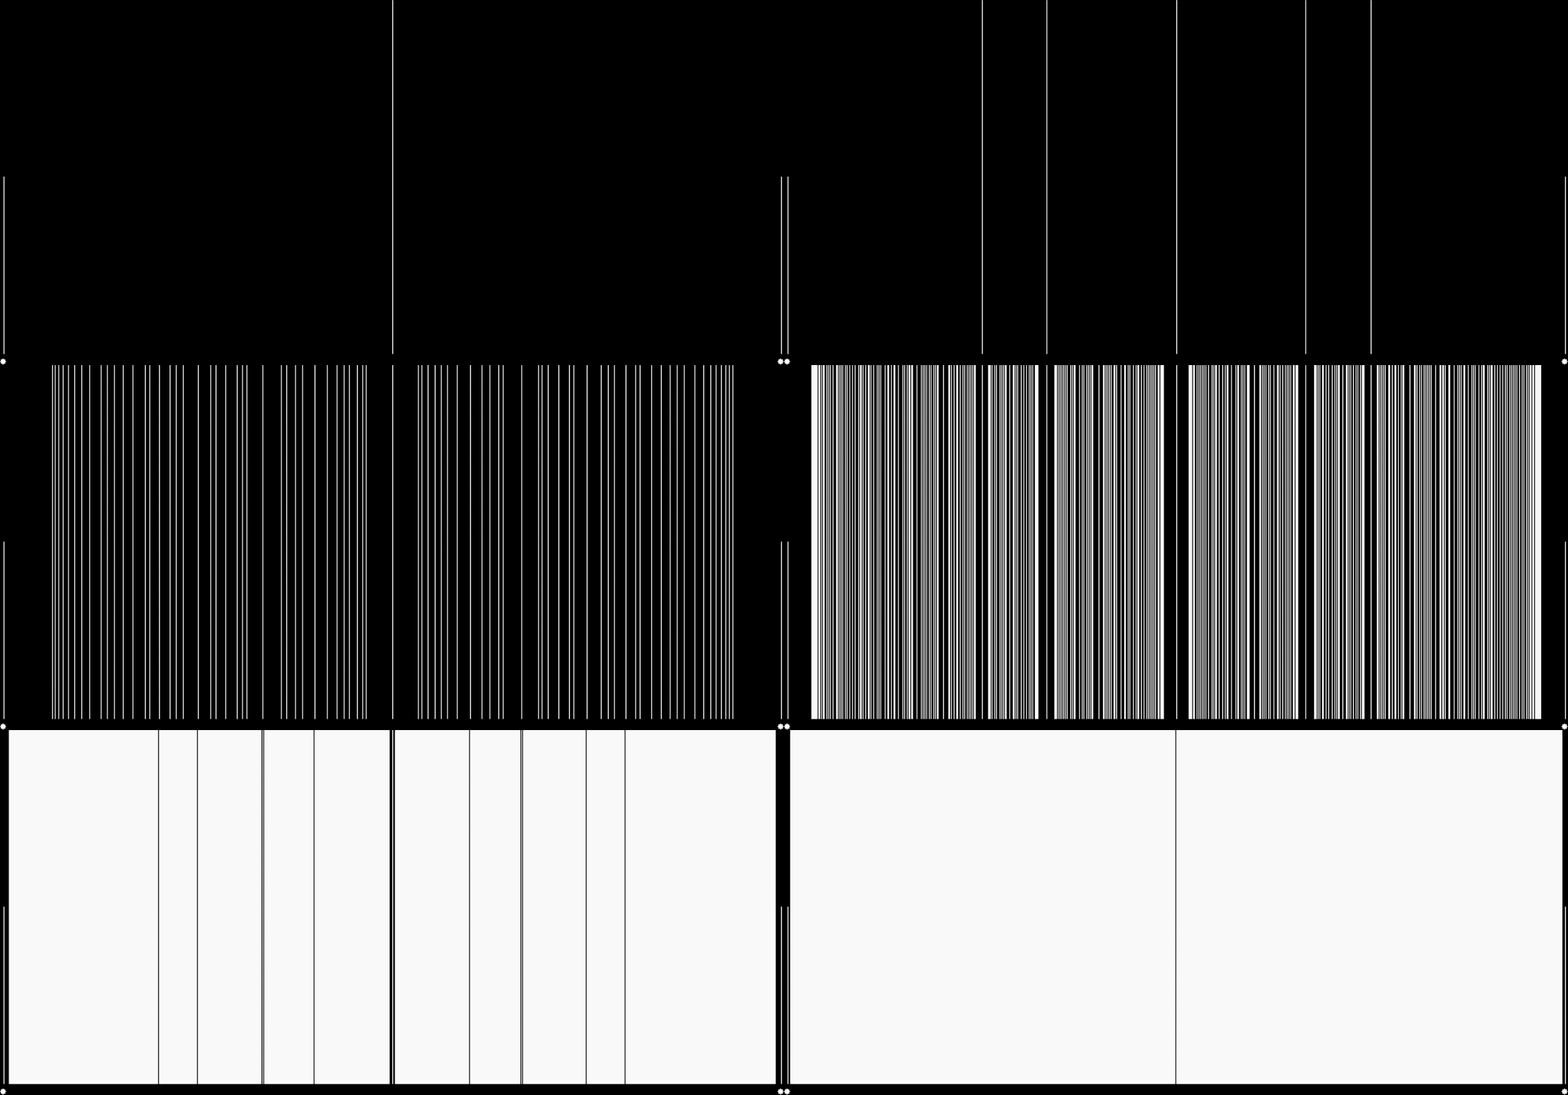
You can combine the zoom-to-be and the zoomed section in a single image, where the full fractal is on the left and the zoomed section on the right:
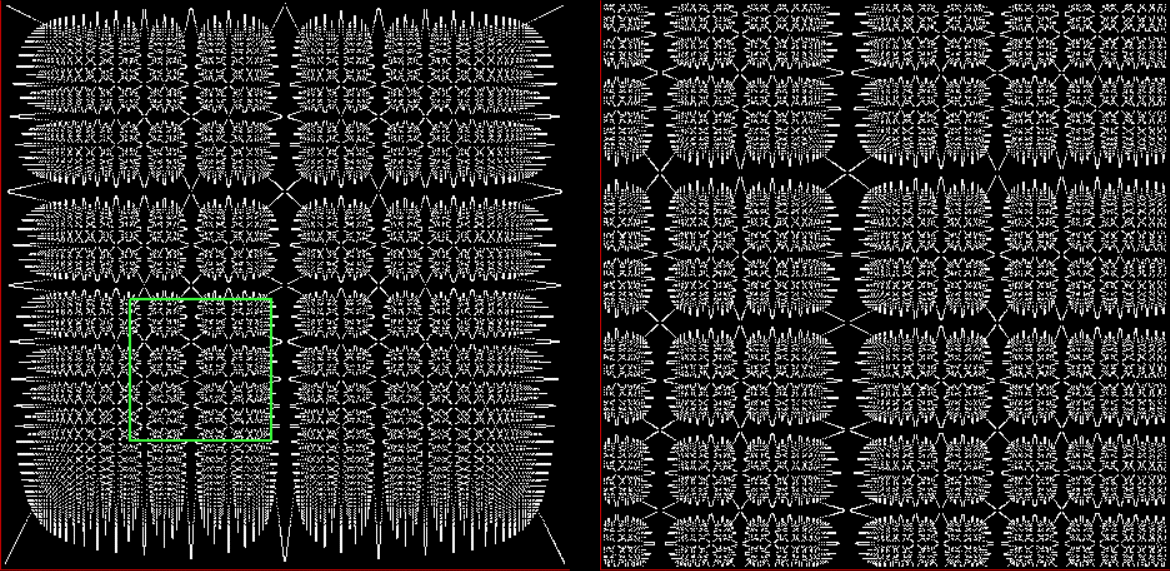
Gryke-to-hike and Gryke-hiked (click for larger)


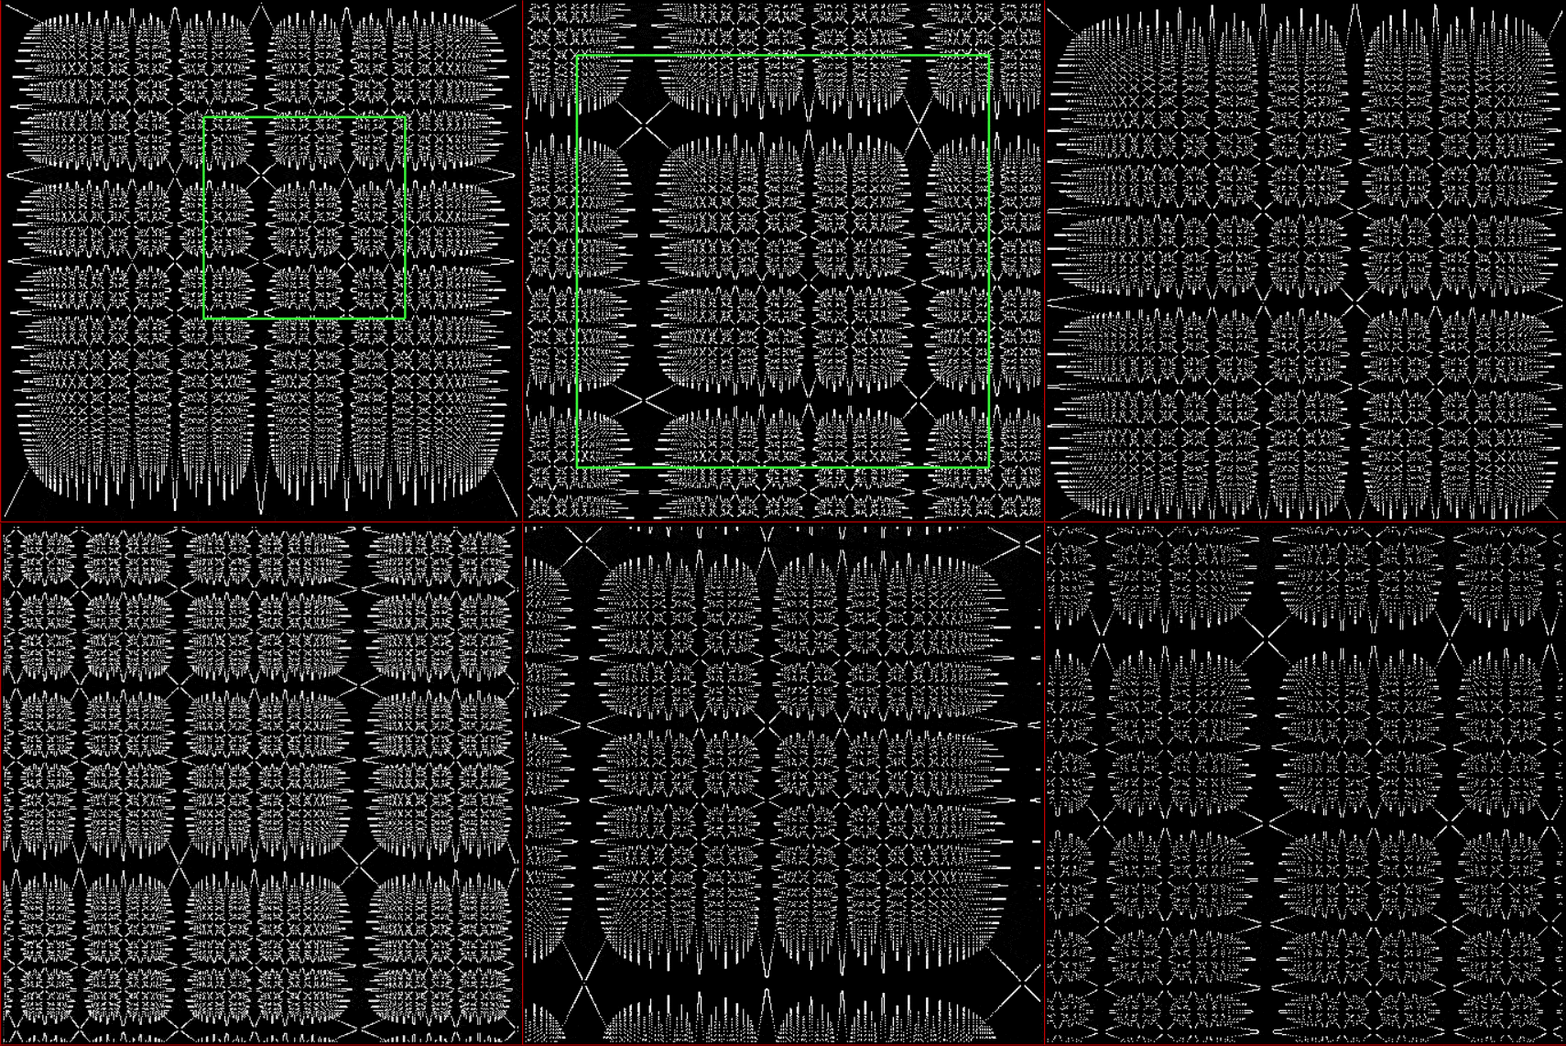
Here are more hikes of the gryke, or zooms of the full fractal:
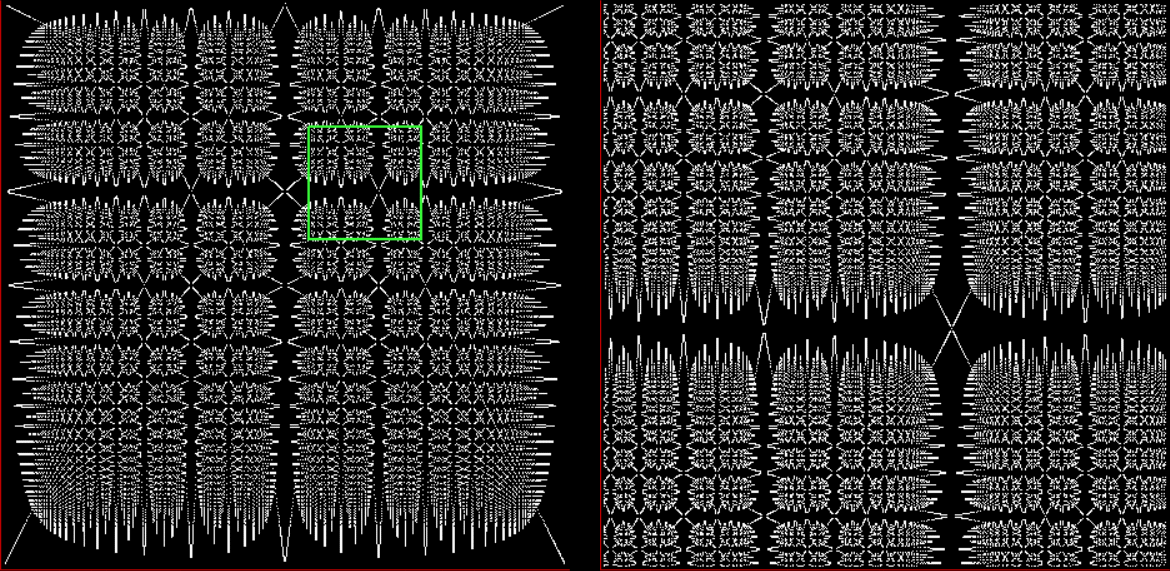
Zoom #2
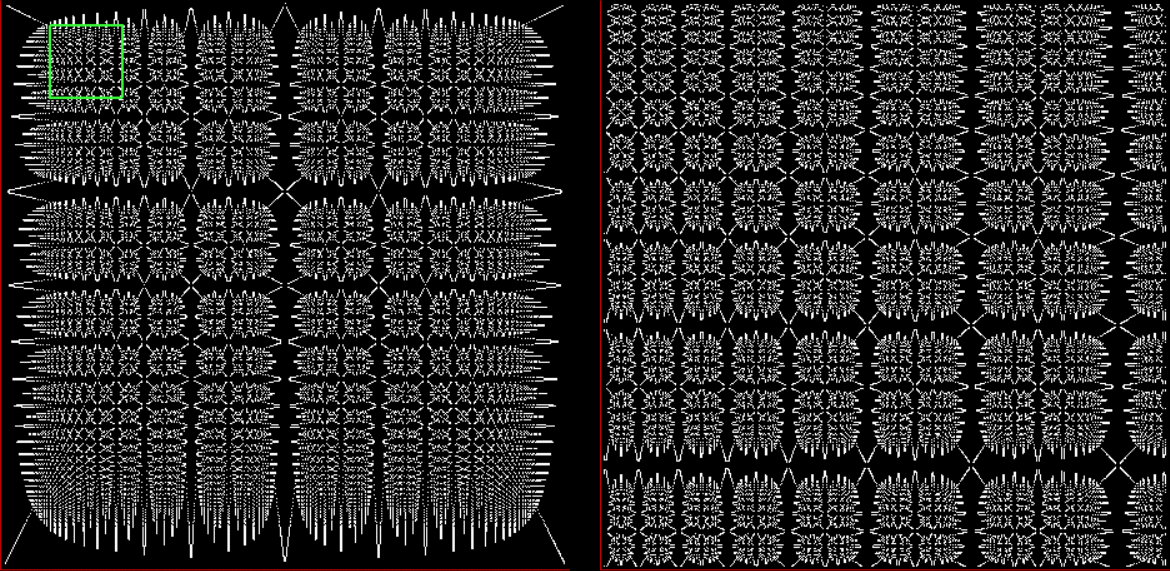

Zoom #3
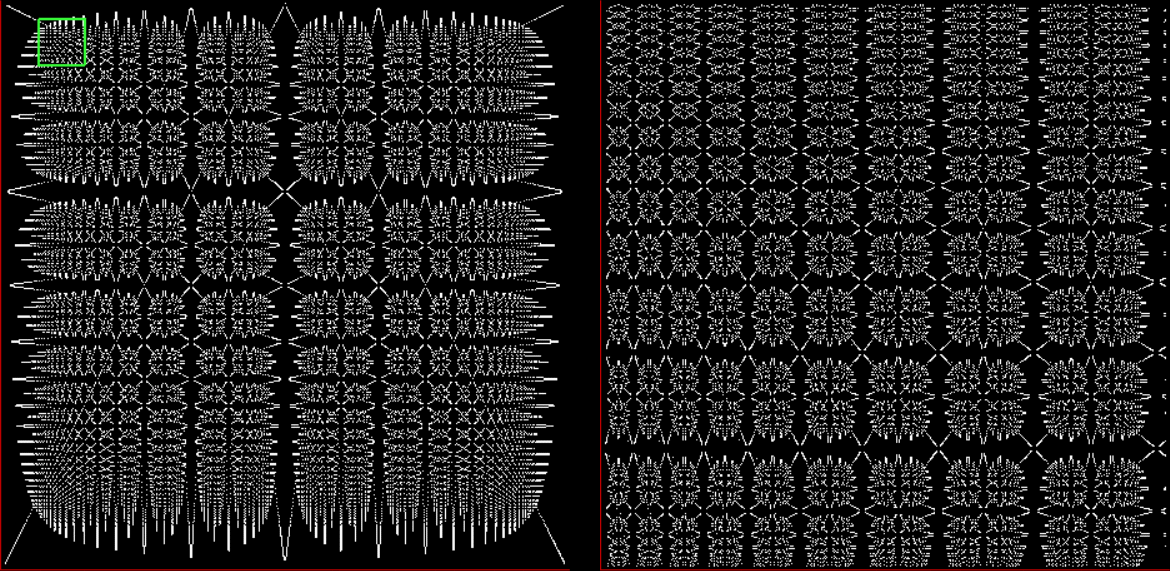

Zoom #4
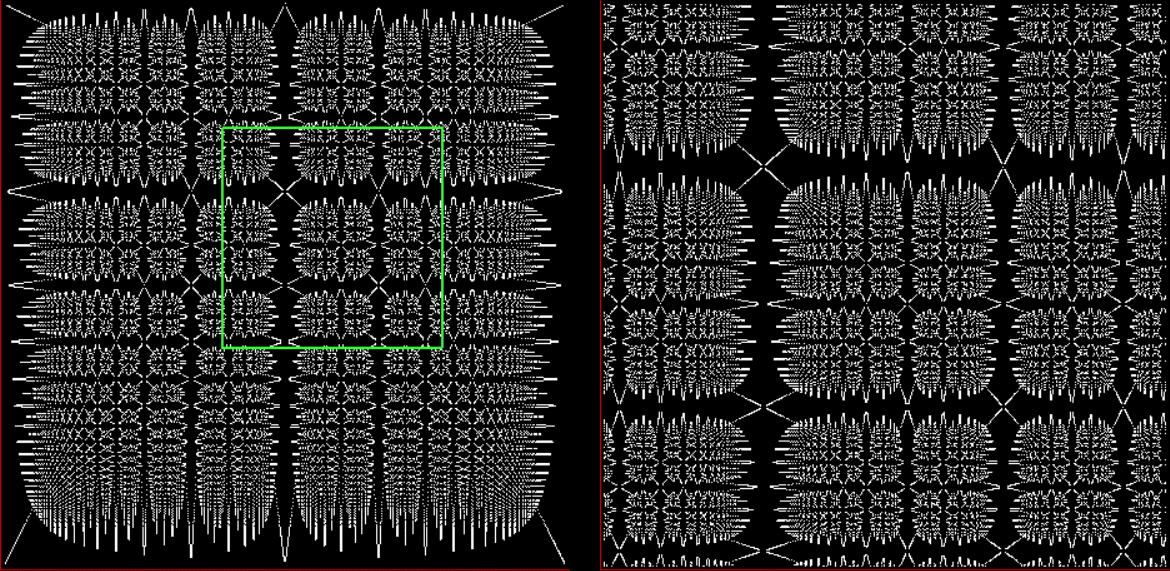

Zoom #5
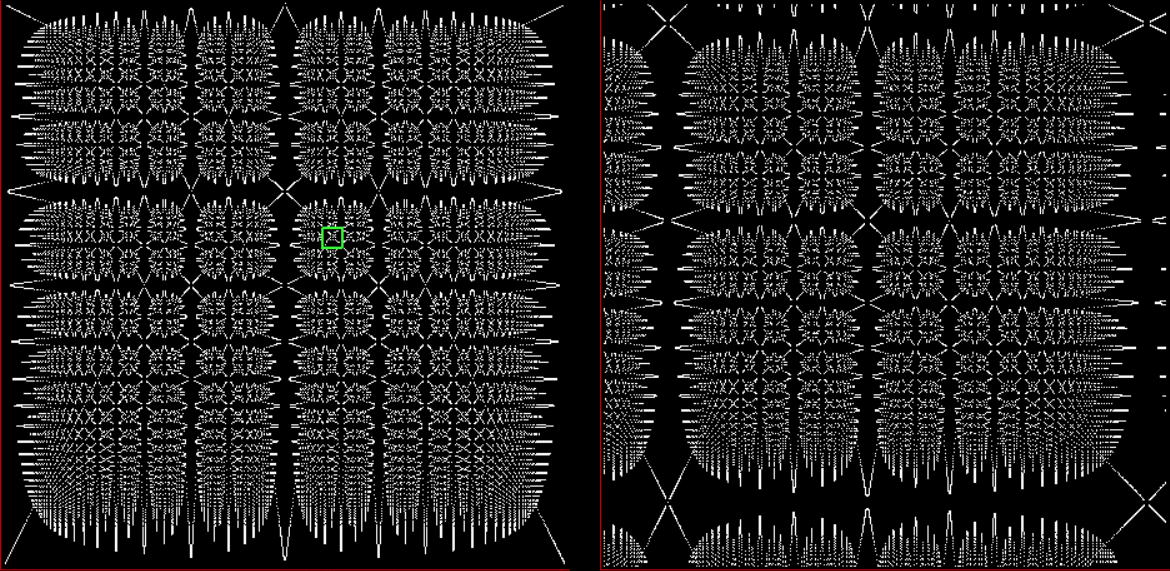

Zoom #5+1

Zoom #5+2

Zoom #6


And here’s an animated gryke-hike or zoom into a single section of the fractal:
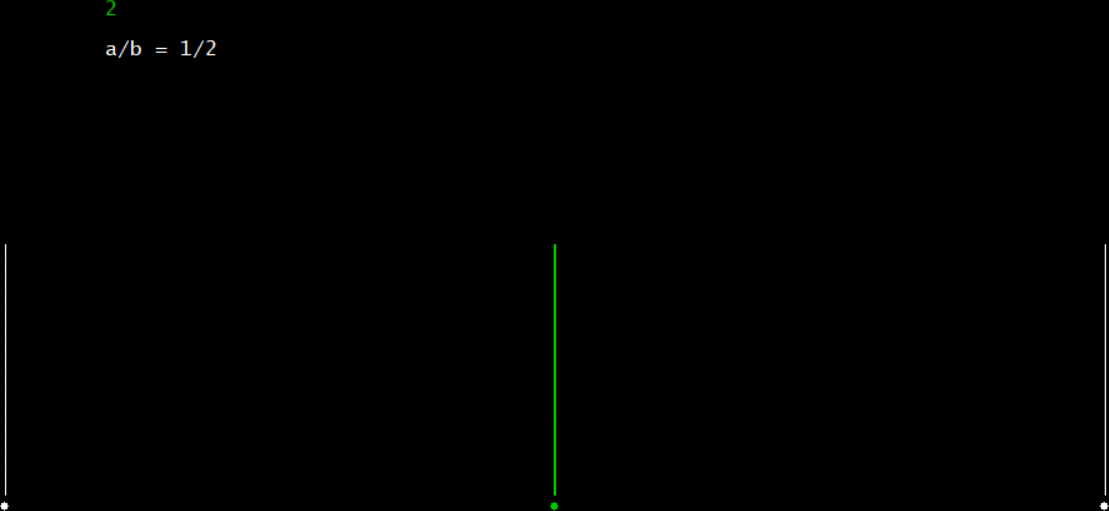
Hiking the Gryke (animated at ezGif)


Previously Pre-Posted…

• I Like Gryke — a first look at the gryke fractal
• Worms in Terms of Perms — permutating the gryke fractal

Crack to Back

From The Ultimate Christmas Cracker (2019), compiled by John Julius Norwich:

Useful Palindromes

What other words would spring to the lips when break­ing the news of the death of a prize herd of cat­tle, smit­ten with in­fec­tive epilepsy?

Stiff, O dairy­man! In a myr­iad of fits!

Dr Barnardo mak­ing out the menus:

Desserts I de­sire not, so long no lost one rise dis­tressed.

The re­buke of the high-prin­ci­pled lady to her rich Nor­man lover:

Di­a­mond light, Odo, doth gild no maid.

When Pyramids Decay

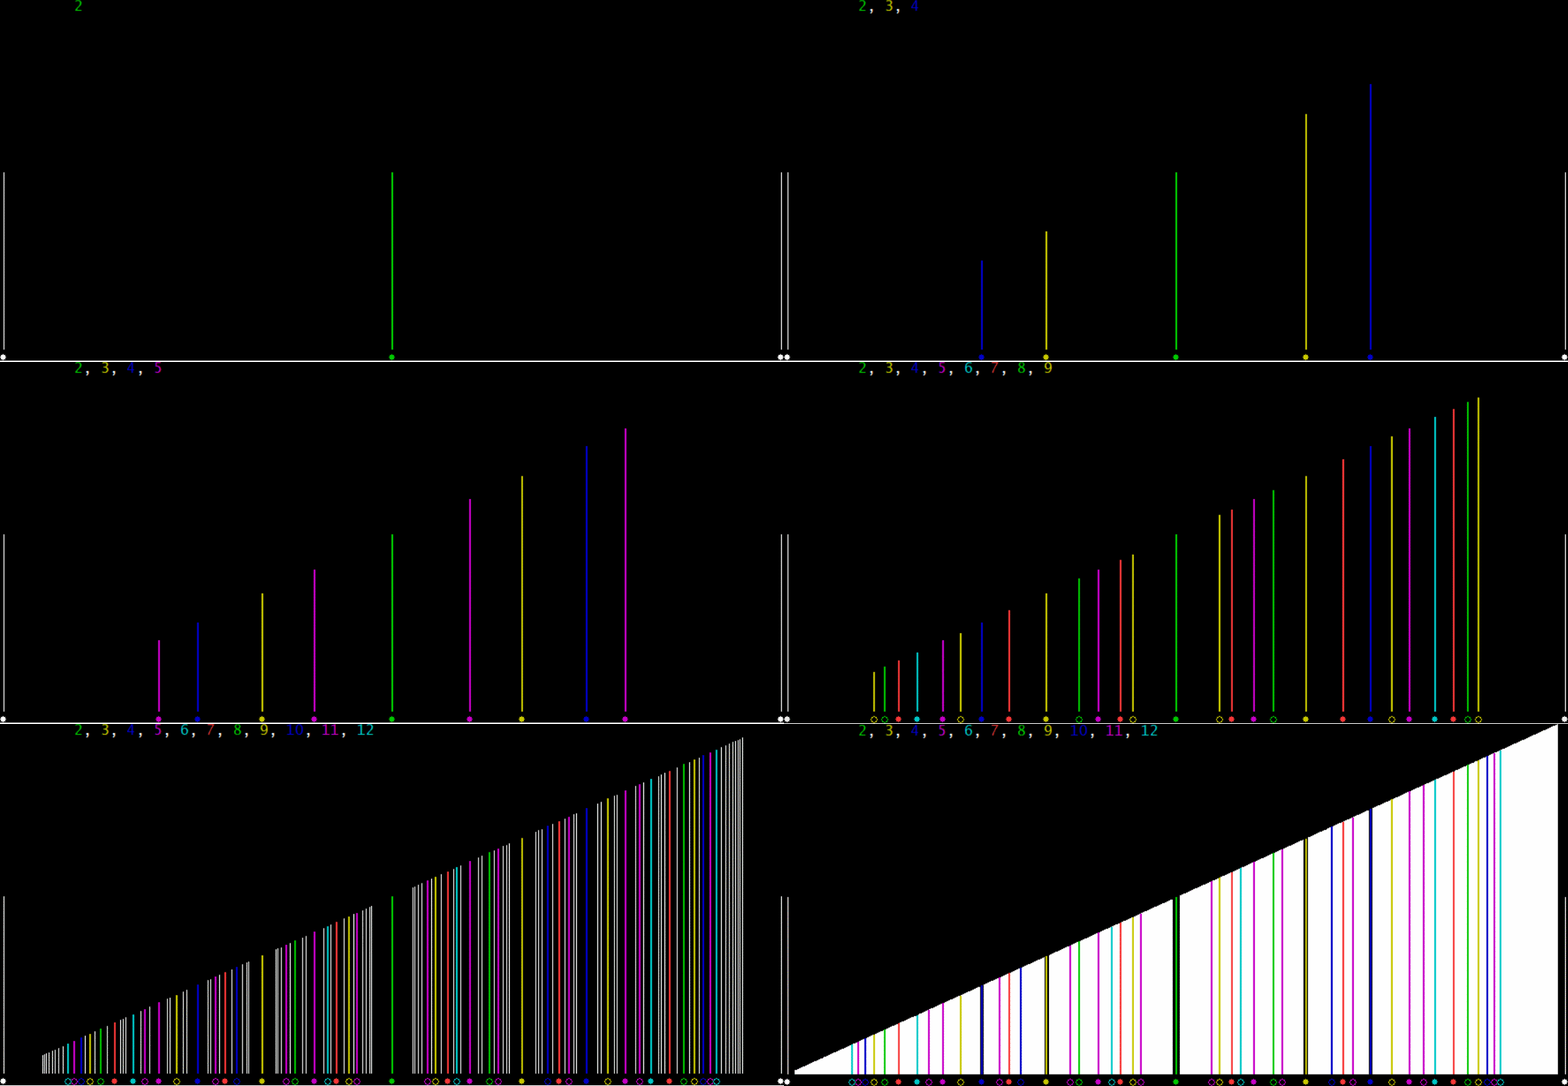
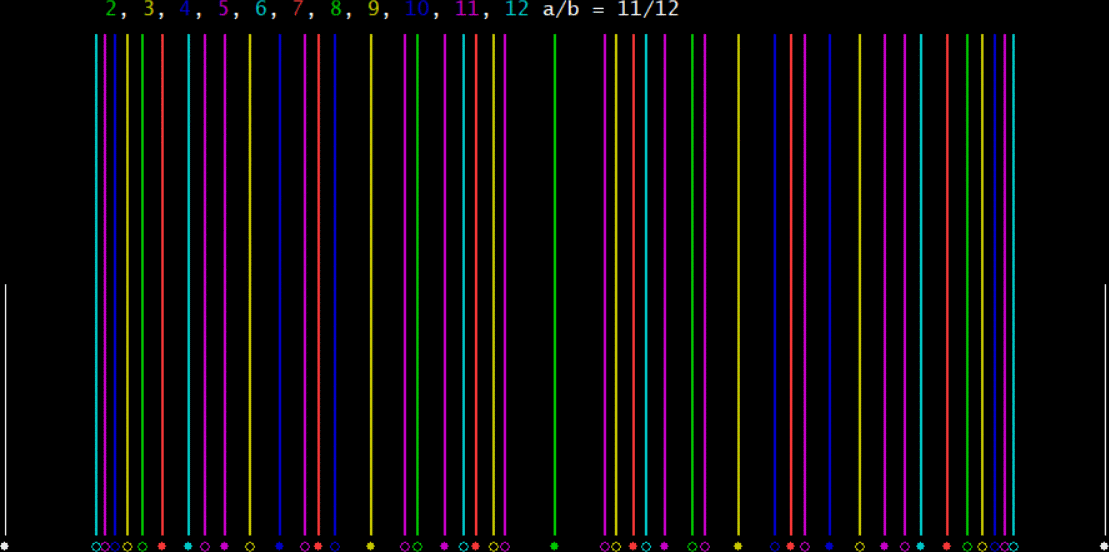
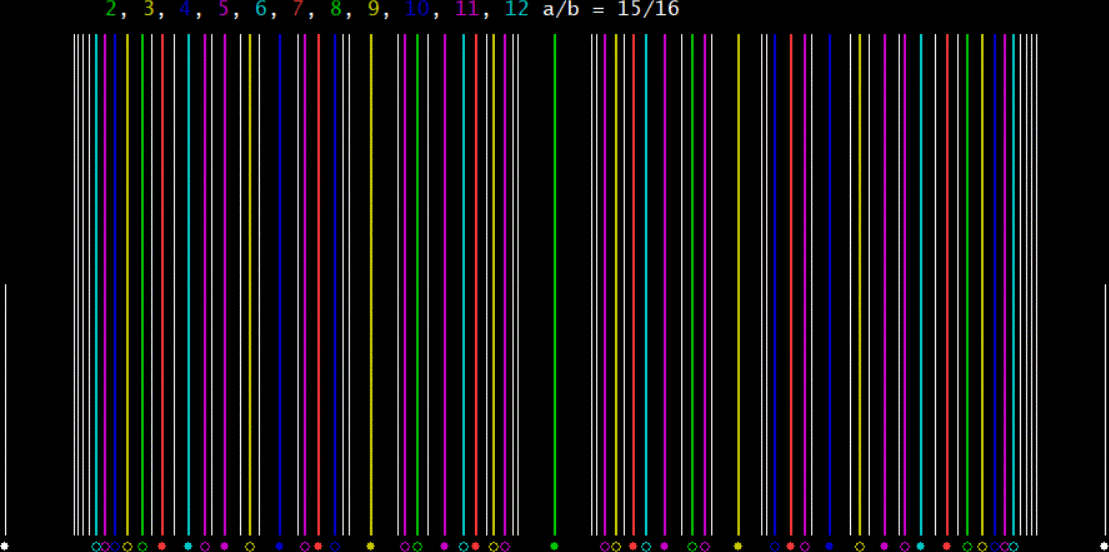
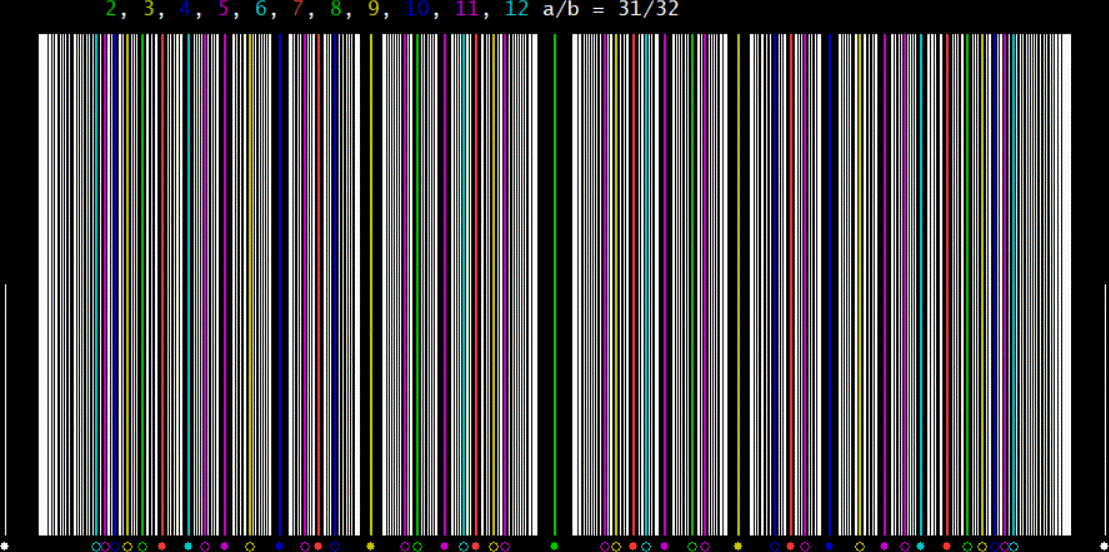
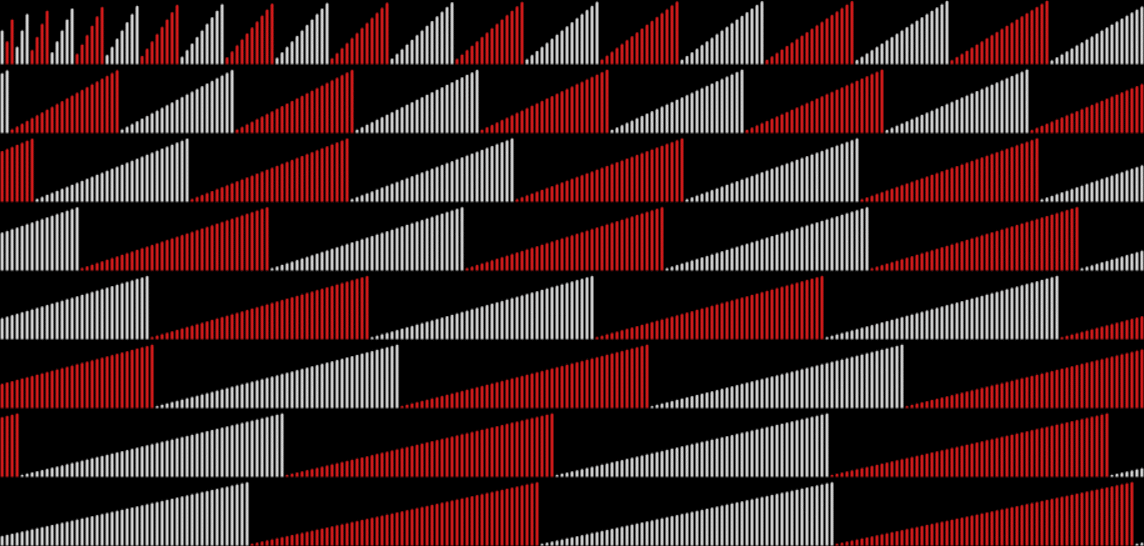
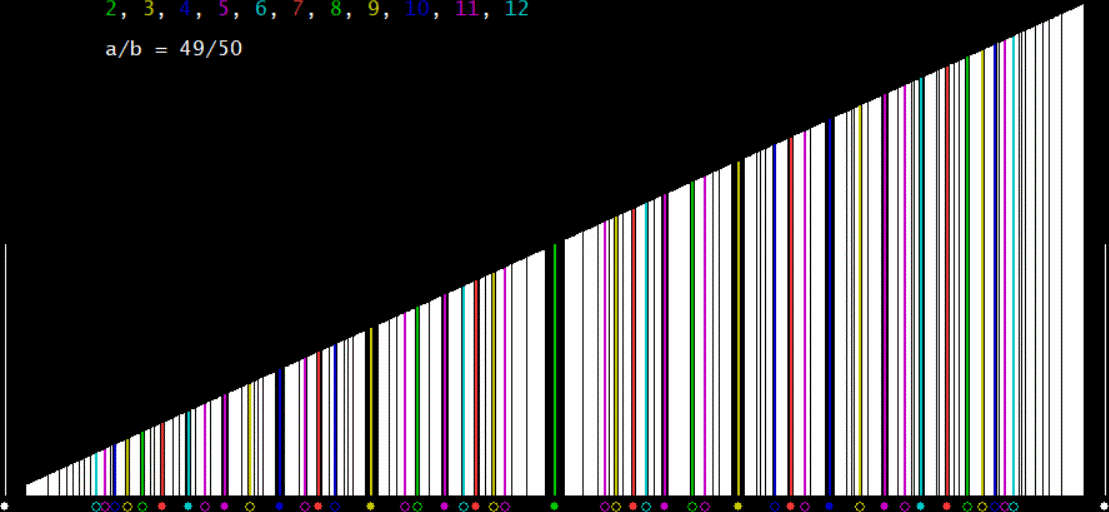
What’s the point of writing 2/10? It’s equal to 1/5, just as 4/10 = 2/5, 6/10 = 3/5 and 8/10 = 4/5. But there are times when the full-fat form can be mathematically — and æsthetically — appropriate. For example, you get a nice series of triangular waves — and an optical illusion — when you use all the rational fractions to create a graph representing the size of the fraction, a/b, as 0 < a/b < 1. If the even denominators are in white and the odd denominators in red, the graph looks like this:

Graph of 1/2, 1/3, 2/3, 1/4, 2/4, 3/4, 1/5, 2/5, …
(click for larger)


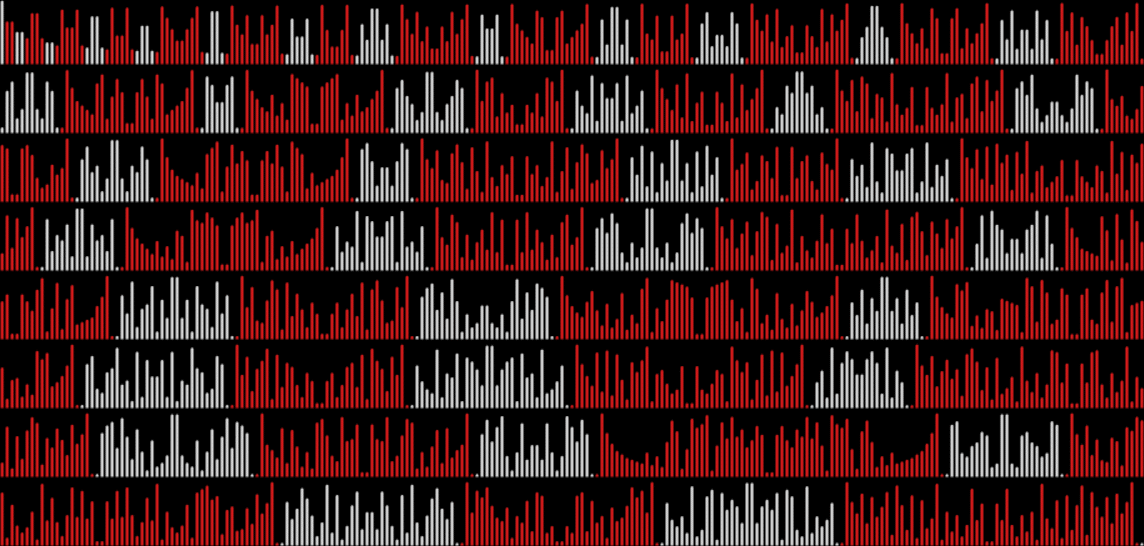
The optical illusion is that the lines of waves appear to sink from left to right. Otherwise the graph has no complexity. But suppose you take the continued fraction of a/b, reverse it, and calculate a new fraction from the reversal. If you use the fractions in simplest form, you get this graph:

Graph of a2/b2 = reversed(contfrac(a1/b1)) for 1/2, 1/3, 2/3, 1/4, 3/4, …


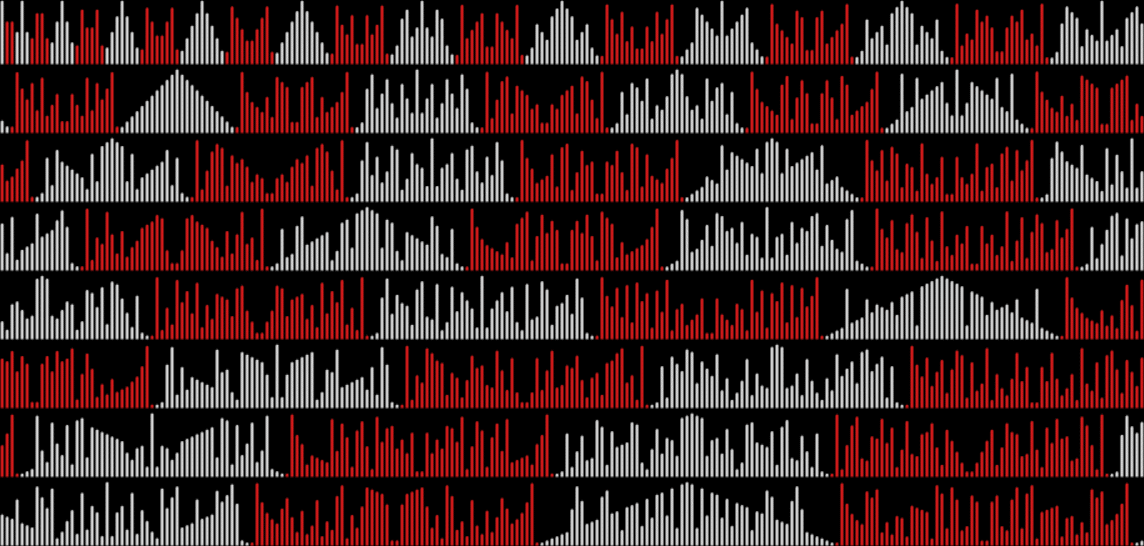
But if you use all the rational fractions, simplified and unsimplified, you get a graph with pyramids and ships, like this:

Graph of a2/b2 = reversed(contfrac(a1/b1)) for 1/2, 1/3, 2/3, 1/4, 2/4, 3/4, …


The full pyramids are few, alas. But the other ones decay in interesting ways.

Knock Around the Clock

Possly the cleverest or funniest knock-knock joke ever created. But you might not get it.


Knock-knock.
Who’s there?

Knock-knock.
Who’s there?

Knock-knock.
Who’s there?

Knock-knock.
Who’s there?

Knock-knock.
Who’s there?

Knock-knock.
Who’s there?

Knock-knock.
Who’s there?

Knock-knock.
Who’s there?

Knock-knock.
Who’s there?

Knock-knock.
Who’s there?

Knock-knock.
Who’s there?

Knock-knock.
Who’s there?

Knock-knock.
Who’s there?

Knock-knock.
Who’s there?

Knock-knock.
Who’s there?

Knock-knock.
Who’s there?

Knock-knock.
Who’s there?
Philip Glass.


• Joke by the photo-realist artist Chuck Close

Takes on Flakes

The Koch Snowflake is a fractal named after the Swedish mathematician Helge von Koch (1870-1924). It’s simple to make, attractive to see:
A Koch snowflake


And here’s how you making it, starting with an equilateral triangle:
Make the Flake #0


Make the Flake #1: Erect a 1/9-sized equilateral triangle on middle of each side

Make the Flake #2: Then a 1/81-sized equilateral triangle on the middle of each straight line created by #1


Make the Flake #3: And so on.


Make the Flake #4


Make the Flake #5


Make the Flake #6


Make the Flake #0-6 (animated at ezGif)


In the end, the Koch snowflake has an infinitely long perimeter around a finite area (see discussion at Wikipedia). The Koch anti-snowflake or un-flake also combines an infinitely long perimeter and finite area:

Koch un-Flake


You make the un-flake like this:

Make the Un-Flake #0


Make the Un-Flake #1


Make the Un-Flake #2


Make the Un-Flake #3


Make the Un-Flake #4


Make the Un-Flake #5


Make the Un-Flake #6


Make the Un-Flake #0-6 (animated at ezGif)


And you can combine the Koch snowflake and the Koch anti-snowflake like this:

Make the Flake+Un-Flake #0


Make the Flake+Un-Flake #1


Make the Flake+Un-Flake #2


Make the Flake+Un-Flake #3


Make the Flake+Un-Flake #4


Make the Flake+Un-Flake #5


Make the Flake+Un-Flake #6


Make the Flake+Un-Flake #0-6 (animated at ezGif)


Here’s another variation, what you might call the Koch-Cross flake:

Koch-Cross Flake #0


Koch-Cross Flake #1


Koch-Cross Flake #2


Koch-Cross Flake #3


Koch-Cross Flake #4


Koch-Cross Flake #5


Koch-Cross Flake #6


Koch-Cross Flake #0-6 (animated at ezGif)


And the Koch-Cross un-flake:

Koch-Cross un-Flake


And combined Koch-Cross Flake+un-Flake:

Combined Koch-Cross Flake+un-Flake


Here’s an animation of the combined Koch-Cross Flake+un-Flake:

Combined Koch-Cross Flake+un-Flake (animated at ezGif)


And the combined Koch-Cross Flake+un-Flake created on the sides of a square:

Combined Koch-Cross Flake+un-Flake on square


And a final variant of the infinitely many on offer:

Variant Koch snowflake stage #1


Variant Koch snowflake stage #6


Un-Flake of variant Koch snowflake


Combined variant Koch Flake+un-Flake


Mixed Merzaphor

“The chancellor’s unsuccessful strategy for spiking the AfD’s guns has been to ape its draconian positions on immigration.” — The Guardian view on Friedrich Merz: Germany’s chancellor must change course to halt the rise of the AfD, The Guardian, 21ix26

Back in Frac

Here’s a graph representing the fractional parts of √n for n = 1 to 1832, with frac(√1) at the top left and frac(√1832) at the bottom right:

graph for frac(√n), n = 1..1832


There’s an odd optical illusion making it seem as though each set of triangular waves ends lower on the right than it starts on the left. Otherwise, it’s a dull graph, because the fractional part of √n simply rises towards 0.9999…, then falls to 0 like this:

0 = frac(1) = frac(√1)
0.414213562373… = frac(1.414213562373…) = frac(√2)
0.732050807568… = frac(1.732050807568…) = frac(√3)
0 = frac(2) = frac(√4)
0.236067977499… = frac(2.236067977499…) = frac(√5)
0.449489742783… = frac(2.449489742783…) = frac(√6)
0.645751311064… = frac(2.645751311064…) = frac(√7)
0.828427124746… = frac(2.828427124746…) = frac(√8)
0 = frac(3) = frac(√9)
0.162277660168… = frac(3.162277660168…) = frac(√10)
0.316624790355… = frac(3.316624790355…) = frac(√11)
0.464101615137… = frac(3.464101615137…) = frac(√12)
0.605551275463… = frac(3.605551275463…) = frac(√13)
0.741657386773… = frac(3.741657386773…) = frac(√14)
0.872983346207… = frac(3.872983346207…) = frac(√15)
0 = frac(4) = frac(√16)
0.123105625617… = frac(4.123105625617…) = frac(√17)
0.242640687119… = frac(4.242640687119…) = frac(√18)
0.358898943540… = frac(4.358898943540…) = frac(√19)
0.472135954999… = frac(4.472135954999…) = frac(√20)

But what about the fractional parts of the sum of √n? What does that graph look like? Much more interesting:

frac(sum(√n)), n = 1..1832


Here are the fractional parts for the sum of √n:

0 = frac(1) = frac(sum(√1))
0.414213562373… = frac(02.414213562373…) = frac(sum(√1..√2))
0.146264369941… = frac(04.146264369941…) = frac(sum(√1..√3))
0.146264369941… = frac(06.146264369941…) = frac(sum(√1..√4))
0.382332347441… = frac(08.382332347441…) = frac(sum(√1..√5))
0.831822090224… = frac(10.831822090224…) = frac(sum(√1..√6))
0.477573401289… = frac(13.477573401289…) = frac(sum(√1..√7))
0.306000526035… = frac(16.306000526035…) = frac(sum(√1..√8))
0.306000526035… = frac(19.306000526035…) = frac(sum(√1..√9))
0.468278186204… = frac(22.468278186204…) = frac(sum(√1..√10))
0.784902976559… = frac(25.784902976559…) = frac(sum(√1..√11))
0.249004591697… = frac(29.249004591697…) = frac(sum(√1..√12))
0.854555867161… = frac(32.854555867161…) = frac(sum(√1..√13))
0.596213253935… = frac(36.596213253935…) = frac(sum(√1..√14))
0.469196600142… = frac(40.469196600142…) = frac(sum(√1..√15))
0.469196600142… = frac(44.469196600142…) = frac(sum(√1..√16))
0.592302225760… = frac(48.592302225760…) = frac(sum(√1..√17))
0.834942912879… = frac(52.834942912879…) = frac(sum(√1..√18))
0.193841856420… = frac(57.193841856420…) = frac(sum(√1..√19))
0.665977811419… = frac(61.665977811419…) = frac(sum(√1..√20))

As with square roots, so with cube roots. The graph of frac(∛n) looks like this:

frac(∛n), n = 1..1832


It’s dull again, because the fractional part of ∛n is simply rising towards 0.9999…, then falling to 0. Just more slowly. But the graph of frac(sum(∛n)) looks like this:

frac(sum(∛n))


But roots don’t end with √n and ∛n, of course. Those roots represent n^(1/2) and n^(1/3), respectively, because when x = n^(a/b), n = x^(b/a). What about the graph of sum(n^(4/5)), where n = (n^4/5)^(5/4)? The graph looks like this:

frac(sum(n^(4/5)))


One of the curves in that graph reminds of the cephalopodic tentacles in Jean Delville’s marvellous painting Les Trésors de Sathan (sic) (Treasures of Satan) (1895), which was used on the cover of Morbid Angel’s Blessed Are the Sick (1991). The curve is longer in frac(sum(n^(84/97))):

frac(sum(n^(84/97))) (curve in red)


Les Trésors de Sathan (1895) by Jean Delville as the cover of Blessed Are the Sick (1991)


frac(sum(n^(4/5))) (curve in red)


Those Delvillean curves are examples of how, as the a/b of n^(a/b) climbs from 1/b to (b-1)/b, the graph of frac(sum(n^(a/b))) changes in interesting ways. Here are the graphs for n^(1..10/11):

frac(sum(n^(1/11)))


frac(sum(n^(2/11)))


frac(sum(n^(3/11)))


frac(sum(n^(4/11)))


frac(sum(n^(5/11)))


frac(sum(n^(6/11)))


frac(sum(n^(7/11)))


frac(sum(n^(8/11)))


frac(sum(n^(9/11)))


frac(sum(n^(10/11)))


Here’s an animation of those graphs:

animation of frac(sum(n^(1/11..10/11))) (created at ezGif)


And here are graphs for n^(72/83) and n^(82/83), with a Delvillean curve in the graph of 72/83 and domes in the graph of 82/83:

frac(sum(n^(72/83)))


frac(sum(n^(82/83)))


As the denominators get bigger, so do the domes:

frac(sum(n^(1000/1009)))


frac(sum(n^(1001/1009)))


frac(sum(n^(1002/1009)))


frac(sum(n^(1003/1009)))


frac(sum(n^(1004/1009)))


frac(sum(n^(1005/1009)))


frac(sum(n^(1006/1009)))


frac(sum(n^(1007/1009)))


frac(sum(n^(1008/1009)))


Here’s an animation of those graphs:

animation of frac(sum(n^(1000/1009..1008/1009))) (created at ezGif)


Previously Pre-Posted…

• Think Frinc — an earlier look at fraction-patterns
• Altars of Mathness — and similar patterns from integer-digits


Elsewhere Other-Accessible…

• Jean Delville at Wikipedia
• Blessed Are the Sick at BandCamp