Middlemoth

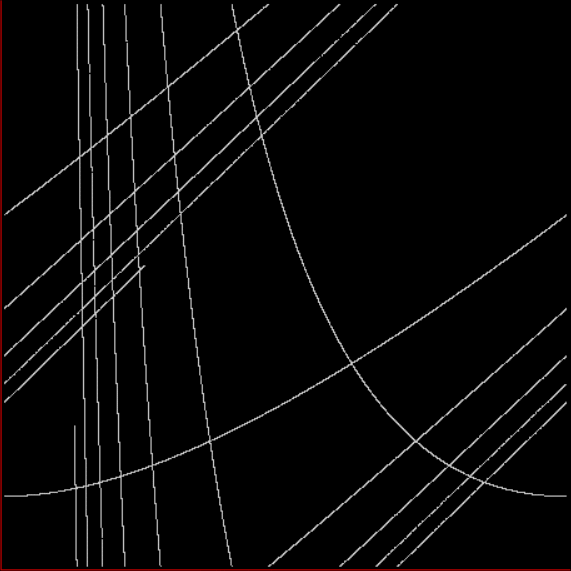
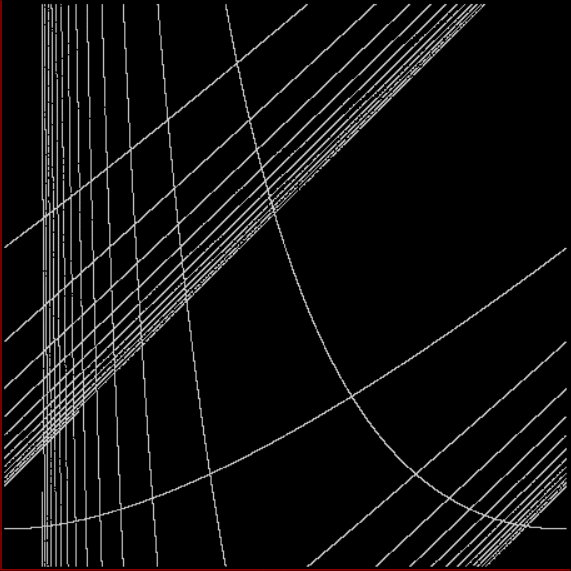
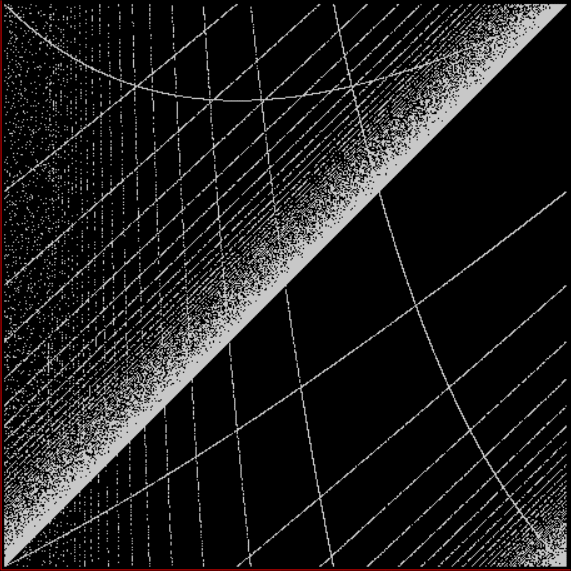
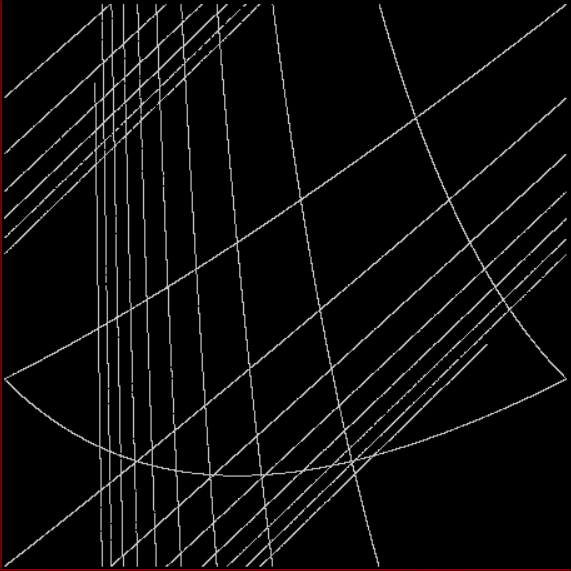
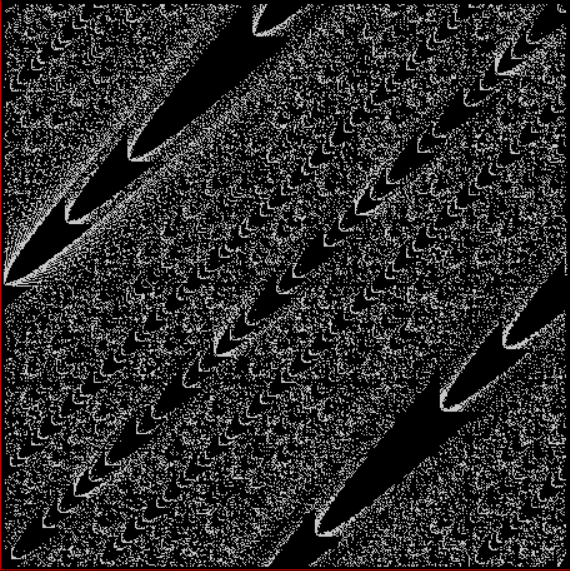
I’ve never read Middlemarch (1871). But I have seen a middlemoth. It was when I was looking at a new way of creating fractLs. A fractL is what I call a graph shaped like a capital L, with the x- and y-axes representing values between 0 and 1, like 1/2 and 1/3 and 8/55. You can also use numbers > 1 to create numbers < 1: 73 → 0.73; 128719 → 0.128719; and so on. But I decided to reverse the integer before converting it: 73 → 0.37; 128719 → 0.917821; and so on. And use different bases for the x- and y-axes. So that’s what I did on a fractL: I mapped fractions converted from integers in one base against fractions converted from integers in another base. The results, as you can see, were spectacularly dull:

fractL for int→frac in base 2 and base 6


fractL for int→frac in base 3 and base 6


fractL b04, b06


fractL b06, b08


So I decided to try some perspectivision, mapping the integer-fractions not on a fractL but on a fractO instead. A fractO is a circle where you find a point inside the circle by using two fractions, fr1 and fr2, to create two radian values: θ1 = fr1 * 2 * π and θ2 = fr2 * 2 * π. Then you use θ1 and θ2 to find two points on the perimeter of the circle, (x1, y1) and (x2, y2), and then find their midpoint, (x3, y3) = ((x1, y1) + (x2, y2)) / 2. The results this time are much more pleasing on the eye:

fractO for integers in base 2 and base 6

fractL b02, b06, for fractO b02, b06


Here’s an animated gif showing the conversion from visually dull fractL to visually interesting fractO:

fractL b02b06 to fractO b02b06 (animated at EZgif)


When I was looking at more fractOs, I found one that was lepidopterally interesting too:

fractO b09, b12 with middlemoth


fractO b09, b12 (middlemoth in green)


You can try spotting more pareidolia in more fractOs from reversed fractintegers:

fractO b03, b15

fractL b03, b15 for fractO above


fractL b03b15 to fractO b03b15 (animated at EZgif)


fractO b02, b10


fractO b02, b12


fractO b02, b14


fractO b03, b06


fractO b03, b12


fractO b03, b21


fractO b04, b06


fractO b04, b20


fractO b06, b08


fractO b09, b15


fractO b10, b24


fractO b12, b16


fractO b15, b20


fractO b24, b28


fractO b42, b78


fractO b02, b18 (fr2 x 3)


fractO b02, b06 (fr2 x 3)
Formulas Focal to the Flesh

Here’s an interesting formula:

fr(1) = 1/2; mx = 3
fr(i) = fr(i-1) + 1/fr(i-1)
if fr(i) > mx, fr(i) = fr(i) – mx

Early terms look like this:

0.5, 2.5, 2.9, 3.244827586…, 4.329334628…, 2.081590666…, 2.561992513…, 2.952313716…, 3.291031107…, 3.727089920…, 2.102435627…, 2.578074447…, 2.965960841…, 3.303119709…, 3.602146368…, 2.262872154…, 2.704788415…, 3.074503101…, 13.49676325…, 10.59203071…, 7.723747777…, 4.935444092…, 2.452121378…, 2.859931533…, 3.209590254…, 4.980804482…, 2.485649867…, 2.887959143…, 3.234224430…, 4.503633905…, 2.168689406…

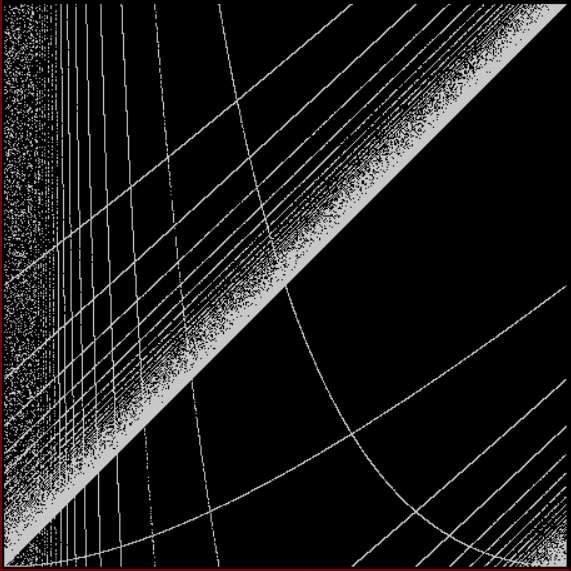
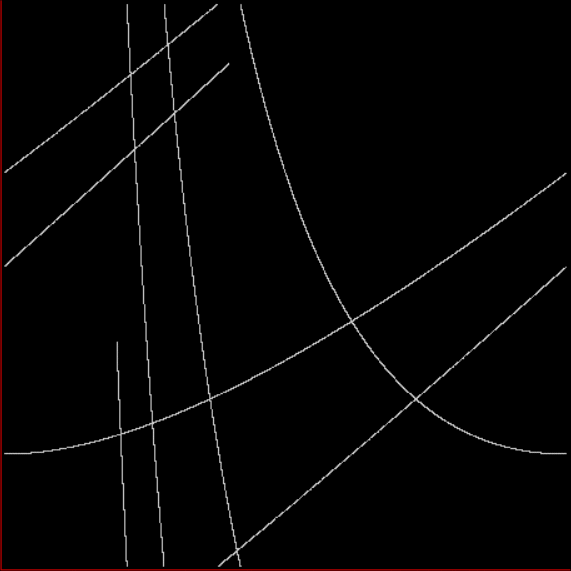
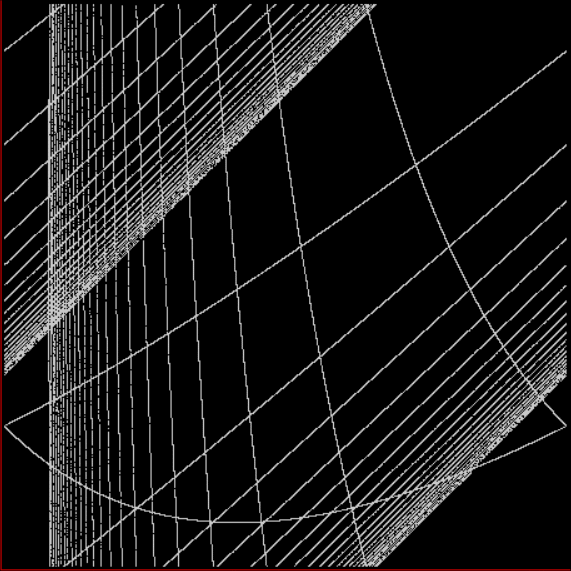
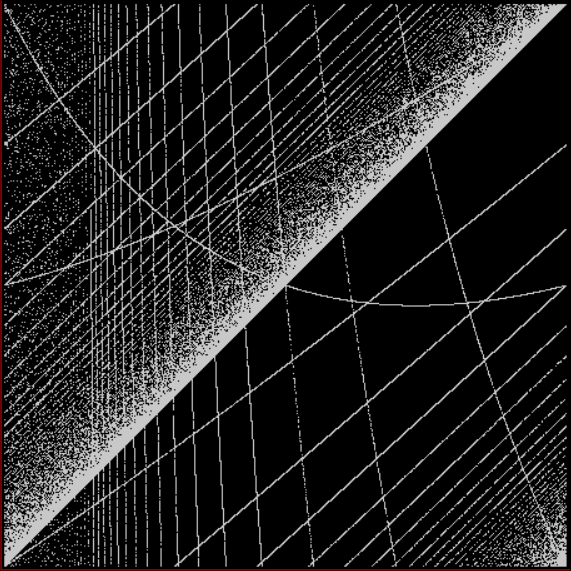
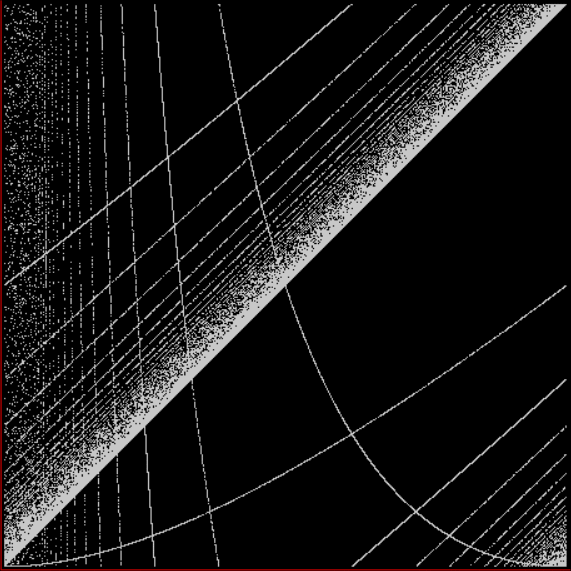
Can you see any patterns emerging? I’d guess not. And I’d guess a thousand more terms wouldn’t help you see any better. It’s hard for humans to see patterns in a jumble of numbers. Our eyes don’t work as well on numbers as on shapes. That’s why you can make that formula focal to the flesh, as it were, by plotting the numbers on a graph. Or part of the numbers, anyway. Suppose you take the fractional parts of each pair of terms and use them to map (x,y) on a FractL (my name for a graph whose arms run from 0 to 1). For example, the terms 4.935444092… and 2.452121378… would yield x = 0.935444092… and y = 0.452121378… (or vice versa). The resultant graph makes the formula focal to the flesh. And it’s replete with patterns:

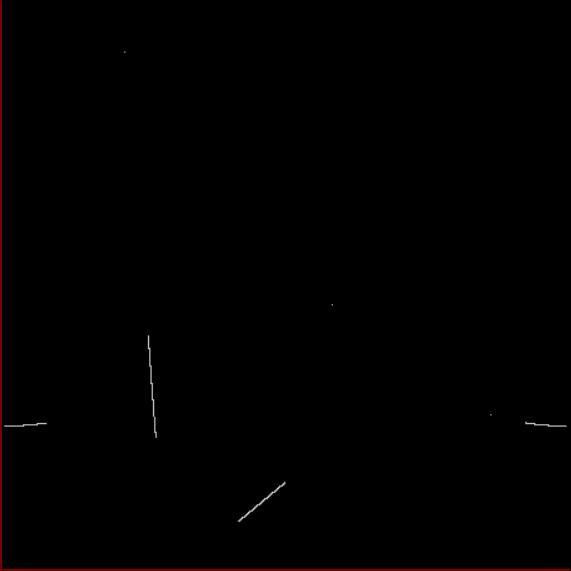
fr(i)+=1/fr(i-1); if fr(i)>3, fr(i)-=3; x = frac(fr(i)), y = frac(fr(i+1))


I can’t explain the patterns and they may arise from limited precision in the decimal digits. But I like them however they arise. The graph doesn’t change when mx = 4 (although it creates the lines in a different order):

if fr(i)>4, fr(i)-=4


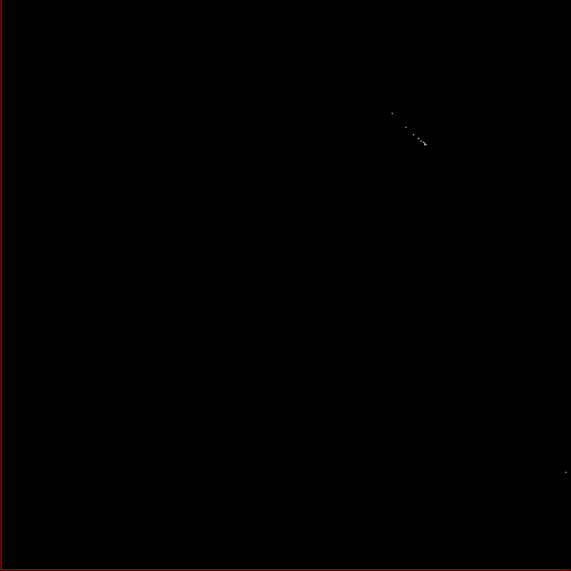
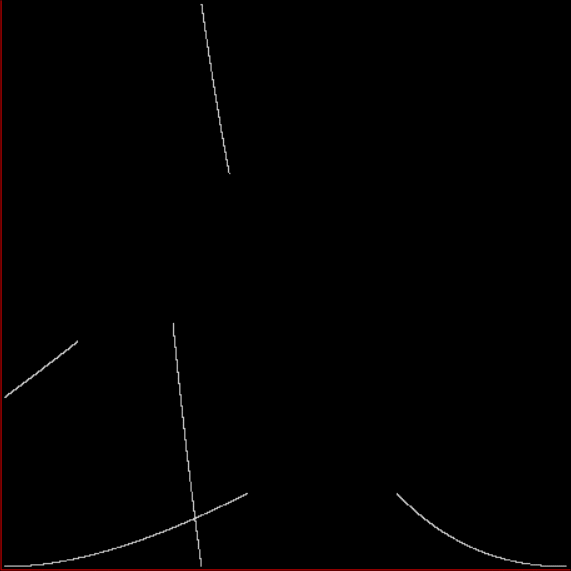
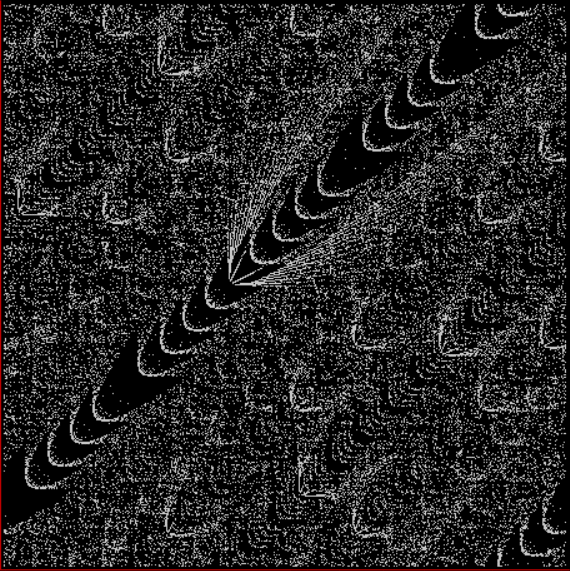
But it does change when mx = 4/3. The lines almost vanish, except for a tiny comet-like mark towards the upper right-hand corner:

if fr(i)>4/3, fr(i)-=4/3


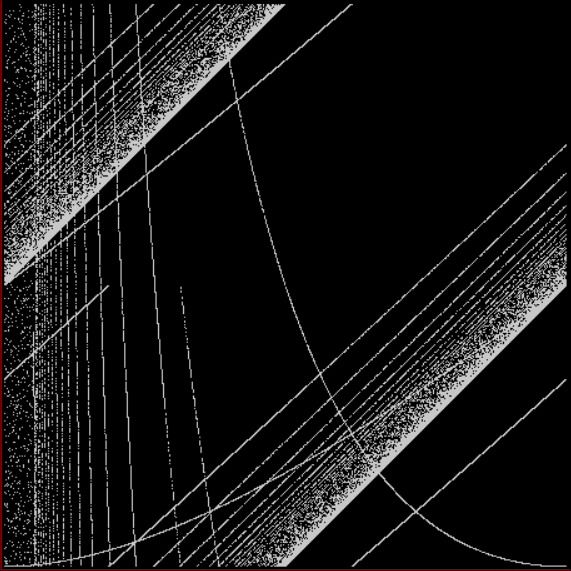
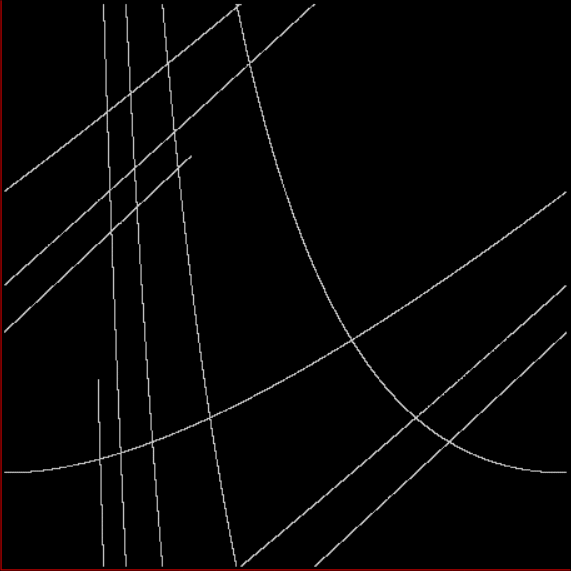
When mx = 7/2, the graph of mx = 3|4 is back in a slightly different form:

if fr(i)>7/2, fr(i)-=7/2


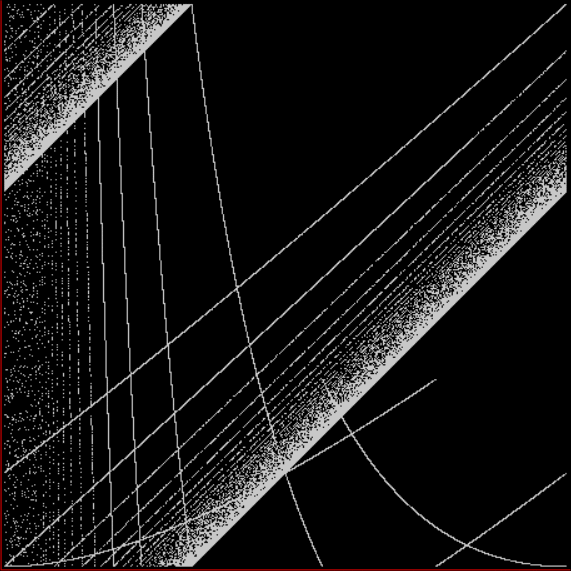
And again with 7/3:

if fr(i)>7/3, fr(i)-=7/3


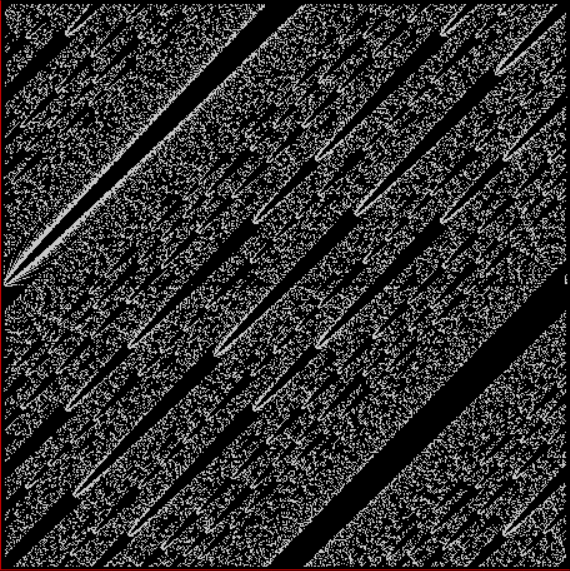
There’s a big change with 7/4, Most of the lines disappear:

if fr(i)>7/4, fr(i)-=7/4


And only the main lines appear with 9/5:

if fr(i)>9/5, fr(i)-=9/5


And so on till you try fr -= 2/f, as noted below:

if fr(i)>11/5, fr(i)-=11/5


if fr(i)>11/6, fr(i)-=11/6


if fr(i)>15/8, fr(i)-=15/8


if fr(i)>29/15, fr(i)-=29/15


Now try fr += 2/fr and fr += 3/fr. This is what happens:

fr += 2/fr; if fr(i)>3, fr(i)-=3


fr += 2/fr; if fr(i)>8/3, fr(i)-=8/3


fr += 2/fr; if fr(i)>11/4, fr(i)-=11/4


fr += 3/fr; if fr(i)>6, fr(i)-=6


And what about these graphs?


They’re created by seeding a sum, s, with a fraction, then adding more fractions < 1 whose numerators = 1,2,3… and whose denominators are the prime numbers 1, s -= 1. When s > 1, s -= 1. Then you take the fractional parts of s(i) and s(i+1) and graph (x,y) as above.


Post-Performative Post-Scriptum

The title of this post refers to Morbid Angel’s Formulas Fatal to the Flesh (1998). I’ve never heard it, but I like Morbid Angel’s alphabetically alliterative album-titles.